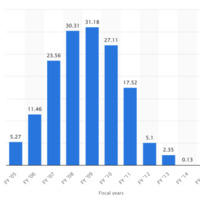
Nintendo DS - Graph of Sales
Dublin Core
Title
Nintendo DS - Graph of Sales
Description
This graph shows the sale of DS units by the millions throughout the fiscal years 2005 until 2015. The graph demonstrates DS sales skyrocketing until 2009 when sales begin to drop rapidly.
Creator
Alexis Dantin
Source
Laricchia, Federica. “Nintendo DS: Sales Worldwide 2005-2015.” Statista, September 30, 2015. https://www.statista.com/statistics/271775/worldwide-sales-of-the-nintendo-ds-since-2004/.
Date
2005-2015
Files
Collection
Citation
Alexis Dantin, “Nintendo DS - Graph of Sales,” Nicholls History of Toys Museum , accessed July 7, 2024, https://nichollshistory.reclaim.hosting/HistoryOfToys/items/show/71.

